2018年5月23日 星期三

License issues

1) Set License debugging ENV variables
setenv FLEXLM_DIAGNOSTICS 3
setenv ALTOS_LM_DIAGNOSTICS 1
setenv CDS_LIC_QA_TesT `pwd`/CDS_LOG_FILE


The last one creates a detailed license debug logfile that shows tools and activity. This is the key.

2) Run the target tool/flow

3) Search the CDS_LOG_FILE for relevant tools and hits
> egrep "Checking out|Initialization" CDS_LOG_FILE

3a) "Initialization started" lines show the tool name and PID.
- Use this to track subsequent activity for that process

3b) "Checking out" lines only show license checkouts
- Useful for tracking tools and licenses used
- Does not show all of the rest of the license activity (check FeatureExists, FeatureStatus, etc.) which are additional license server hits and add to the DDoS effect.

Kill processes

pgrep : grep processes

pkill :  pgrep + kill 的功能,也就是說,你可以給 pkill 任何一組字串或正規表示式 ( Regular Expression) 當參數,然後,pkill 就會去找出所有符合指定條件的程序名稱,接著,就會送出一個結束程序的訊號 ( SIGTERM ) 給這些符合條件的程序來結束掉這些程序

killall : 用完整名稱來搜尋要刪除的程序

killall 指令只會完整比對程序名稱的前 15 個字元,因此,如果你要刪除的那堆程序的名稱有超過 15 字的話,那就要加個「e」選項來要求 killall 指令做完整比對,否則,還是有機會讓 killall 指令刪錯

killall -e del-very-long-long-name-processes 

2018年5月14日 星期一

印出檔案的第一行及最後一行

grep:
grep -E 'Thread|TIMESTAMP' test.log | head -1

Sed:
sed -e 1b -e '$!d' test.log
or
印出找到的第一個
sed -n '/TIMESTAMP/{p;q;}' test.log

Awk:
awk 'NR==1; END{print}' test.log

Linux:
(head -n1 && tail -n1) < test.log

2018年3月26日 星期一

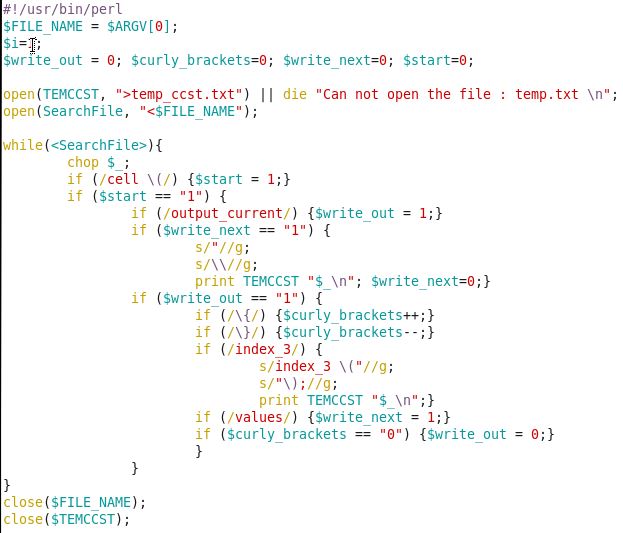
extract CCST table for gnuplot

#!/usr/bin/perl
$FILE_NAME = $ARGV[0];
$i=1;
$write_out = 0; $curly_brackets=0; $write_next=0; $start=0;

open(TEMCCST, ">temp_ccst.txt") || die "Can not open the file : temp.txt \n";
open(SearchFile, "<$FILE_NAME");

while(<SearchFile>){
               chop $_;
               if (/cell \(/) {$start = 1;}
               if($start == "1") {
                      if (/output_current/) {$write_out =1;}
               if($write_next == "1") {
                     s/"//g;
                     s/\\//g;
                     print TEMCCST "$_\n"; $write_next=0;}
               if ($write_out == "1") {
                     if (/\{/) {$curly_brackets++;}
                     if (/\}/) {$curly_brackets--;}
                     if (/index_3/) {
                             s/index_3 \("//g;
                             s/"\);//g;
                             print TEMCCST "$_\n";}
                     if (/values/) {$write_next = 1;}
                     if ($curly_brackets== "0") {$write_out = 0;}
                     }
              }
}
close(SearchFile);
close(TEMCCST);

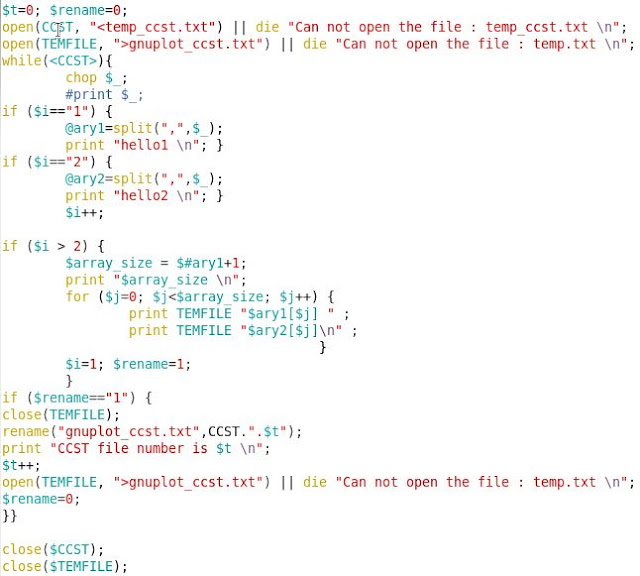
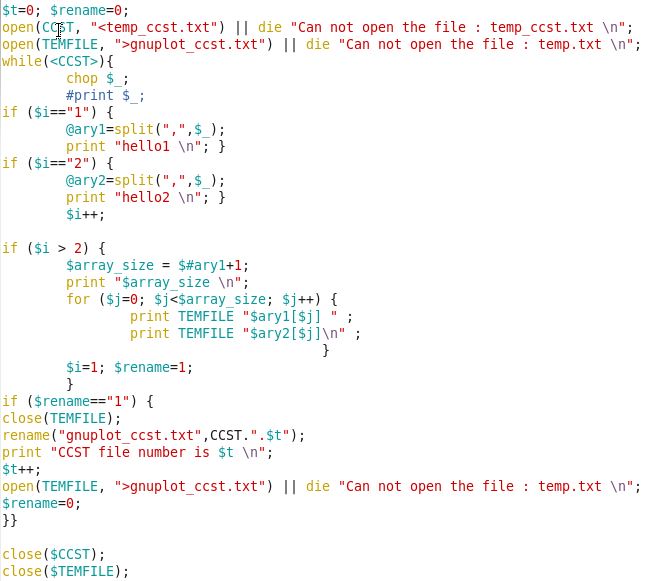
$t=0; $rename=0;
open(CCST, "<temp_ccst.txt") || die "Can not open the file : temp_ccst.txt \n";
open(TEMFILE, ">gnuplot_ccst.txt") || die "Can not open the file : temp.txt \n";
while(<CCST>){
               chop $_;
if ($i=="1") {
             @ary1=split(",",$_);}
if ($i=="2") {
             @ary2=split(",",$_);}
              $i++;

if($i > 2) {
          $array_size = $#ary1+1;
          for ($j=0; $j<$array_size; $j++) {
                       print TEMFILE "$ary1[$j] ";
                       print TEMFILE "$ary2[$j]\n ";
                       }
          $i=1; $rename=1;
           }
if ($rename=="1") {
       close(TEMFILE);
       rename("gnuplot_ccst.txt",CCST.".$t");
       print "CCST file number is $t \n";
       $t++;
       open(TEMFILE, ">gnuplot_ccst.txt") || die "Can not open the file : temp.txt \n";
       $rename=0;
}}

close(CCST);
close(TEMFILE);


Version-II:

#!/usr/bin/perl
$FILE_NAME = $ARGV[0];
$i=1;
$write_out = 0; $curly_brackets=0; $write_next=0; $start=0;

open(TEMCCST, ">temp_ccst.txt") || die "Can not open the file : temp.txt \n";
open(SearchFile, "<$FILE_NAME");

while(<SearchFile>){
               chop $_;
               if (/cell \(/) {$start = 1;}
               if($start == "1") {
                      if (/output_current/) {$write_out =1;}
               if($write_next == "1") {
                     s/"//g;
                     s/\\//g;
                     print TEMCCST "$_\n"; $write_next=0;}
               if ($write_out == "1") {
                     if (/\{/) {$curly_brackets++;}
                     if (/\}/) {$curly_brackets--;}
                     if (/index_3/) {
                             s/index_3 \("//g;
                             s/"\);//g;
                             print TEMCCST "$_\n";}
                     if (/values/) {$write_next = 1;}
                     if ($curly_brackets== "0") {$write_out = 0;}
                     }
              }
}
close(SearchFile);
close(TEMCCST);

use List::Util qw/max min/;
$t=0; $rename=0;
open(CCST, "<temp_ccst.txt") || die "Can not open the file : temp_ccst.txt \n";
open(TEMFILE, ">gnuplot_ccst.txt") || die "Can not open the file : temp.txt \n";
while(<CCST>){
               chop $_;
if ($i=="1") {
             @ary1=split(",",$_);
              $max_index_3 = max @ary1;
              $min_index_3 = min @ary1;
               push (@accumulated_max_index_3, $max_index_3);
               push (@accumulated_min_index_3, $min_index_3);
               print "The index_3 size is " ; print scalar @ary1; print "\n";
               print "The max number of index_3 is $max_index_3 , The min is $min_index_3 \n";}
if ($i=="2") {
             @ary2=split(",",$_);
              $max_value = max @ary2;
              $min_value = min @ary2;
               push (@accumulated_max_value, $max_value);
               push (@accumulated_min_value, $min_value);
               print "The value size is " ; print scalar @ary2; print "\n";
               print "The max number of value is $max_value , The min is $min_value \n";}
              $i++;

if($i > 2) {
          $array_size = $#ary1+1;
          for ($j=0; $j<$array_size; $j++) {
                       print TEMFILE "$ary1[$j] ";
                       print TEMFILE "$ary2[$j]\n ";
                       }
          $i=1; $rename=1;
           }
if ($rename=="1") {
       close(TEMFILE);
       rename("gnuplot_ccst.txt",CCST.".$t");
       print "CCST file number is $t \n";
       $t++;
       open(TEMFILE, ">gnuplot_ccst.txt") || die "Can not open the file : temp.txt \n";
       $rename=0;
}}

$accumulated_max_index_3 = max @accumulated_max_index_3;
$accumulated_min_index_3 = min @accumulated_min_index_3;
$accumulated_max_value = max @accumulated_max_value;
$accumulated_min_value = min @accumulated_min_value;

print "\n";
print "#######################\n";
print "print out max/min index_3/value \n";
print "#######################\n";
print "The whole max/min index_3 are $accumulated_max_index_3/$accumulated_min_index_3 \n";
print "The whole max/min value are $accumulated_max_value/$accumulated_min_value \n";

my $max = max @array;
my $min = min @array;

## Print out size of index_3 and value of CCST
#$array_size = $#ary1+1;
#print "$array_size \n";
#print scalar @ary1;
#print scalar @ary2;

close(CCST);
close(TEMFILE);

Version-III:

#!/usr/bin/perl
$FILE_NAME = $ARGV[0];
$i=1;
$write_out = 0; $curly_brackets=0; $write_next=0; $start=0;

open(TEMCCST, ">temp_ccst.txt") || die "Can not open the file : temp.txt \n";
open(SearchFile, "<$FILE_NAME");

while(<SearchFile>){
               chop $_;
               if (/voltage/) {
                              if (/VDD/) {
                                     s/\);//g;
                                     @rail_voltage=split(",",$_);
                                     $rail_voltage=$rail_voltage[1];
                                                 }} 
               if (/cell \(/) {$start = 1;}
               if($start == "1") {
                      if (/output_current/) {$write_out =1;}
               if($write_next == "1") {
                     s/"//g;
                     s/\\//g;
                     print TEMCCST "$_\n"; $write_next=0;}
               if ($write_out == "1") {
                     if (/\{/) {$curly_brackets++;}
                     if (/\}/) {$curly_brackets--;}
                     if (/index_3/) {
                             s/index_3 \("//g;
                             s/"\);//g;
                             print TEMCCST "$_\n";}
                     if (/reference_time/) {
                             s/reference_time//g;
                             s/://g;
                             s/;//g;
                             print TEMCCST "$_\n";}
                     if (/index_1/) {
                             s/index_1 \("//g;
                             s/"\);//g;
                             print TEMCCST "$_\n";}
                     if (/index_2/) {
                             s/index_2 \("//g;
                             s/"\);//g;
                             print TEMCCST "$_\n";}
                     if (/values/) {$write_next = 1;}
                     if ($curly_brackets== "0") {$write_out = 0;}
                     }
              }
}
close(SearchFile);
close(TEMCCST);

use List::Util qw/max min/;
$t=0; $rename=0;
open(CCST, "<temp_ccst.txt") || die "Can not open the file : temp_ccst.txt \n";
open(TEMFILE, ">gnuplot_ccst.txt") || die "Can not open the file : temp.txt \n";


open(VOLTAGE, ">gnuplot_voltage.txt") || die "Can not open the file : temp.txt \n";
while(<CCST>){
               chop $_;
if ($i=="1") {$ref_time = $_;} ## reference_time
if ($i=="2") {$slew= $_;}        ## slew
if ($i=="3") {$load = $_;}       ## load
if ($i=="4") {                           ## time steps
             @ary1=split(",",$_);
              $max_index_3 = max @ary1;
              $min_index_3 = min @ary1;
               push (@accumulated_max_index_3, $max_index_3);
               push (@accumulated_min_index_3, $min_index_3);
               print "The index_3 size is " ; print scalar @ary1; print "\n";
               print "The max number of index_3 is $max_index_3 , The min is $min_index_3 \n";}
if ($i=="5") {                            ## current steps
             @ary2=split(",",$_);
              $max_value = max @ary2;
              $min_value = min @ary2;
               push (@accumulated_max_value, $max_value);
               push (@accumulated_min_value, $min_value);
               print "The value size is " ; print scalar @ary2; print "\n";
               print "The max number of value is $max_value , The min is $min_value \n";}
              $i++;

if($i > 5) {
          $array_size = $#ary1+1;
          for ($j=0; $j<$array_size; $j++) {
                       print TEMFILE "$ary1[$j] ";
                       print TEMFILE "$ary2[$j]\n ";
                       }
          for ($j=0; $j<$array_size; $j++) {
                       print VOLTAGE "$ary1[$j] ";
                              if ($j == "0") {$voltage=$rail_voltage;}
                              if ($j > 0) {
                                                  $avg_current=($ary2[$j]+$ary2[$j-1])/2;
                                                  $time_step=$ary1[$j]-$ary1[$j-1];
                                                  $voltage_step=($avg_current*$time_step)/$load;
                                                  $voltage=$v_init+$voltage_step;}
                       $v_init=$voltage;
                       print VOLTAGE "$voltage\n ";
                       }
          $i=1; $rename=1;
           }
if ($rename=="1") {
       close(TEMFILE);  close(VOLTAGE);
       rename("gnuplot_ccst.txt",CCST.".$t");  rename("gnuplot_voltage.txt",VOLTAGE.".$t");
       print "CCST/VOLTAGE file number is $t \n";
       $t++;
       open(TEMFILE, ">gnuplot_ccst.txt") || die "Can not open the file : temp.txt \n";


       open(VOLTAGE, ">gnuplot_voltage.txt") || die "Can not open the file : temp.txt \n";
       $rename=0;
}}

$accumulated_max_index_3 = max @accumulated_max_index_3;
$accumulated_min_index_3 = min @accumulated_min_index_3;
$accumulated_max_value = max @accumulated_max_value;
$accumulated_min_value = min @accumulated_min_value;

print "\n";
print "#######################\n";
print "print out max/min index_3/value \n";
print "#######################\n";
print "The whole max/min index_3 are $accumulated_max_index_3/$accumulated_min_index_3 \n";
print "The whole max/min value are $accumulated_max_value/$accumulated_min_value \n";

my $max = max @array;
my $min = min @array;

## Print out size of index_3 and value of CCST
#$array_size = $#ary1+1;
#print "$array_size \n";
#print scalar @ary1;
#print scalar @ary2;

close(CCST);
close(TEMFILE);
close(VOLTAGE);

2018年3月25日 星期日

gnuplot plot example for sim.print and CCST

1.
#!/usr/bin/gnuplot

set ylabel "voltage"
set xlabel "time"
plot "sim.print" using 1:2 with linespoints title "v(ZN)"

set ylabel "current"
plot "sim.print" using 1:3 with linespoints title "i(VZN)"

set ylabel "voltage+current"
plot "sim.print" using 1:2 with linespoints title "v+i", "sim.print" using 1:3 with linespoints title "i(VZN)"

plot "sim.print" using 1:2:3 title "v+i"

2.
set xrange [-2:52]
set yrange [0:0.12]

3.
plot 'battery.dat' using 1:($2*1000):($3*1000)

2017年12月11日 星期一

去除重複的資料

  1. use strict;
  2. use warnings;
  3. my %hash;
  4. while (<DATA>) {
  5.     if (!$hash{$_}) {
  6.         print;
  7.       $hash{$_} += 1;
  8.     }
  9. }

2017年12月6日 星期三

gnuplot

 一些設定說明:
  • set logscale {x,y}:設定X或Y軸或是兩者為logscale    取消:unset logscale
  • set xrange [a:b] 設定X軸範圍從a到b(Y軸亦可);若是看不到圖形,可用set autoscale 自動調回
  • set xlabel "XXX", a,b: 設定X軸的名稱為 XXX (Y軸亦同), 從預設向右移動a,向上移動b
  • set xlabel "XX" font "Times-Italic,26":設定X軸的名稱為XX,以Times-Italic字型大小26顯示
  • set xlabel "XX" font "Times-Roman,24":設定X軸的名稱為XX,以Times-Roman字型顯示
  • set xlabel "XX" textcolor lt 4: 以linetype 4 顯示XX
  • set title "GGG": 設定圖形標題為GGG
  • set xtics a: 設定顯示的X軸座標與刻度, 每次增加 a ;在logscale時,預設的設定會沒有小刻度
  • set xtics a,b: 設定顯示的X軸座標與刻度 起始值a,每次增加b
  • set mxtics a: 顯示X座標軸上的小刻度,每個大刻度間隔除以a的大小顯示一次
  • set xtics (a,b,c): 設定顯示的X軸座標a ,b ,c 與刻度(Y軸亦同)
  • set format y "10^{%L}":Y軸的值以10的L次方顯示
  • set format x "%a.bf": X軸的值以總長a位數,小數點以下b位顯示
  • set format x "%a.be":以科學記號顯示
  • set format x "%g":預設顯示
  • set format x "":不顯示X軸的座標值
  • set key Q,W Left reverse:將圖示與曲線標題倒過來放在圖上座標(Q,W)處,ex:  xy1 +++ ---> +++ xy1
  • set key spacing D:設定圖示間的寬度增加D倍
  • set key title "XXX":設定圖示的名稱
  • set label "SSS" at Q,W:設定SSS這三個字出現在座標(Q,W)處  (網頁上的demo有例子)
  • set label "XX" textcolor lt 2: 以linetype 2 顯示XX
  • set arrow from a,b to c,d:從座標(a,b)畫個箭頭到(c,d),編號第一條箭頭 (可用lw,ls改樣式)
  • set noarrow 1:除去第一號箭頭
  • set arrow from a,b to c,d nohead:畫沒箭頭的箭頭  (疑?那是啥?就是線啦)
  • set term postscript (eps) enhanced color:嵌入一些文字外掛並設定輸出為ps或eps 
               特殊文字的表示法可以在下載的gnuplot程式中找到教學文件或是見PS1        
  • set label "{/Symbol n}={/Italic l}" at Q,W font "Times-Roman,24"
  • set grid: 在各主要刻度畫出格子
  • set grid xtics ytics mxtics mytics:在各刻度畫出格子
  • set grid noxtics x2tics:以上邊的X軸刻度畫出格子(參考實例2)
  • load "FFF.txt": 載入FFF.txt 中的指令,這是相當好用的畫圖方法,畫錯了只要改檔案重畫就行
            PS: 檔案中若是有 # 符號   那這一列就不會被讀取
  • X@^2_{A} : 同時設定某一符號的上下標
  • set datafile missing "Nan": 不要讀(畫)出字串Nan
  • plot "data" u 1:(log($4)): 畫data檔案中的第1行為x,第4行取log值為y

    *  實例1:把兩張圖上下疊在一起
       以下為指令:
        set term post eps enh color 
        set out "test.ps"
        set multiplot                                      <--進入multiplot模式
        set key 0.5,1 Left reverse                 <--設定圖示座標為(0.5,1)並倒過來
        set key spacing 2
        #Figure 1                                          <--#之後不會被讀取  可以用來寫說明
        set xrange [-1:1]
        set yrange [-1:3]
        set xtics (-1,-0.75,-0.5,0.25,0,0.5,1)  <--設定要顯示的X軸座標
        set ytics (-1,-0.5,0,0.5,1,1.5,2,2.5)
        set tmar 0                  <--因為要把第二張圖貼在第一張上緣,所以上面邊界設為0,但是只有這樣作的話,下面那張會比小,因為下面那張的的座標部份也算在邊界界內,所以最好的方法是將所有的邊界都設為0

        set bmar 0                
        set rmar 0                   
        set lmar 0 
        set size 0.7, 0.5         <--設定圖的大小:X軸變為0.7倍  Y軸變0.5倍 (縮小比例可讓圖示標題看起來變大)
        set origin 0.1, 0.0   <--設定圖的原點 0.1,0 (不是圖上的座標而是整個圖的座標),若沒有引入eps功能 邊界可能會被切掉,所以原點稍微向右移
        set title "test1" 0,-4 font "Times-Roman,30" <--圖形標題為test1 由原來位置移動(0,-4)到新位置 (0,-4不是圖上座標,是相對原始位置的座標)
        set xla "{/Symbol F^a}" font "Times-Italic,25"  
        set yla "{/Symbol S}" font "Times-Roman,25"    <--設定一些符號並改變字型與大小
        plot "abc.txt" u 1:2 w lp ti "{/Symbol n_1}" pt 5   <--以abc.txt檔案中,第一行為X軸,第二行為Y軸<u 1:2>畫出來,並把資料的點標出來且連線<lp>,點的形式是第五種 <pt 5>,曲線的標題為{/Symbol n_1} <ti "{/Symbol n_1}">
        rep "abc.txt" u 1:3 w lp ti "{/Symbol b_2}" pt 7
        #Figure 2
        set size 0.7, 0.5                                   <--size 要跟第一張圖一樣才會和稱
        set origin 0.1, 0.5                                <--第二張的原點 因為要貼在第一張的上面  所以要跟第一張的設定配合
        set bmar 0                                           <--下緣邊界設為0
        set format x ""                                     <--X軸沒有座標顯示
        set ytics (-1,0,0.5,1,2,2.5,3)
        set xla ""                                              <--X軸沒有名稱
        set yla "{/Symbol S}" font "Times-Roman,25"
        set title "test2" 0,-4 font "Times-Roman,30"
        plot "abc.txt" u 1:2 w lp ti "{/Symbol n_1}" pt 6
        rep "abc.txt" usi 1:4 w lp ti "{/Symbol b_2_3}"  pt 8
        rep "abc.txt" w l lt 1 lc rgb "blue" lw 7  <-- linetype=1, linewidth=7,linecolor=blue(4.2版以後)
        set nomultiplot                                      <--離開multiplot模式

    *實例2:兩個不同Y值的座標軸在同一張圖(參考gnuplot-tips)
      <span style="color: #339966;">set xr [0:2*pi]       
      set yr [-1:1]            <span style="color: #000000;"><--左邊Y軸範圍</span>
      set y2range [0:1]           <span style="color: #000000;"><--右邊Y軸範圍</span>
      plot sin(x)    axis x1y1, \  
             sin(x)**2 axis x1y2 <span style="color: #000000;"> <--畫sin(x)以左邊Y軸當基準,畫sin(x)平方以右邊Y軸當基準</span></span>
      <span style="color: #339966;">set ytics nomirror</span>          <--設定左邊Y的刻度不要鏡射到右邊軸     <span style="color: #339966;"> 
      set y2tics 0, 0.2            <span style="color: #000000;"><--設定Y2的顯示值與刻度       </span></span>
    * 有關含Error bars的作圖
      http://t16web.lanl.gov/Kawano/gnuplot/datafile-e.html#2dim
      http://gnuplot.sourceforge.net/demo/mgr.html      上面兩個網頁有一些例子與說明
      The number of data column required for data plotting depend on a kind of figure, which is summarized below
Data FormatColumnusingwith
(X,Y) dataX Y1:2lines, points, steps, 
linespoints, boxes, etc.
Y has an error of dYX Y dY1:2:3yerrorbars
X has an error of dXX Y dX1:2:3xerrorbars
Y has an error of dY, and
X has an error of dX
X Y dX dY1:2:3:4xyerrorbars
Y has a range of [Y1,Y2]X Y Y1 Y21:2:3:4yerrorbars
X has a range of [X1,X2]X Y X1 X21:2:3:4xerrorbars
Y has a range of [Y1,Y2], and
X has a range of [X1,X2]
X Y X1 X2 Y1 Y21:2:3:4:5:6xyerrorbars
   例子:
      plot "abc.txt" usi 1:2:3:4 with yerrorbars              <---第三跟第四行是Y軸上面與下面的數據點值
      plot "abc.txt" usi 1:2:($2+$3):($2-$4) with error <---第三跟第四行是Y軸誤差的上下量          
                                                                                                    ps:  origin作圖只接受誤差量 
      plot "abc.txt" usi 1:2:3 with error                           <---Y軸只有一種誤差量 

    *  使用Gnuplot來fitting:
       http://www.duke.edu/~hpgavin/gnuplot.html
       參考上述網頁即可 以下是主要的指令
        f1(x) = a1*tanh(x/b1)            <--定義要用來fitting的函數與參數
       a1 = 300; b1 = 0.005;            <--猜的a1與b1初始值
        fit f1(x) 'force.dat' using 1:2 via a1, b1  <--fitting      
PS1:特殊符號表:
ALPHABETSYMBOLALPHABETSYMBOLalphabetsymbolalphabetsymbol
AAlphaNNuaalphannu
BBetaOOmicronbbetaoomicron
CChiPPicchippi
DDeltaQThetaddeltaqtheta
EEpsilonRRhoeepsilonrrho
FPhiSSigmafphissigma
GGammaTTauggammattau
HEtaUUpsilonhetauupsilon
IiotaWOmegaiiotawomega
KKappaXXikkappaxxi
LLambdaYPsillambdaypsi
MMuZZetammuzzeta
PS2:各種線與點的顏色跟大小  (下次再補)


gnuplot script

  • 設定
  • 還有更多設定可以自由變換組合,下面提供較為常見的設定
    • #: 註解行
    • reset: 重新設定
    • set term png enhanced font 'Verdana,10': 設定圖片類型
    • set output 'runtime.png': 存檔名稱
    • set logscale {x,y}: 設定 X 或 Y 軸或是兩者為 logscale
    • set xrange [a:b]: 設定 X 軸範圍從 a 到 b (Y 軸亦可);若是看不到圖形,可用 set autoscale 自動調回
    • set xlabel "XXX", a,b: 設定 X 軸的名稱為 XXX (Y 軸亦同), 從預設向右移動 a,向上移動 b
    • set xlabel "XX" font "Times-Italic,26": 設定X軸的名稱為 XX,以 Times-Italic 字型大小 26
    • set title "GGG": 設定圖形標題為 GGG
    • set xtics a: 設定顯示的 X 軸座標與刻度, 每次增加 a ;在 logscale 時,預設的設定會沒有小刻度
    • set xtics a,b: 設定顯示的 X 軸座標與刻度 起始值 a,每次增加 b
    • set format y "10^{%L}":Y 軸的值以 10 的 L 次方顯示
    • set format x "%a.bf": X 軸的值以總長 a 位數,小數點以下 b 位顯示
    • set format x "%a.be": 以科學記號顯示
    • set format x "": 不顯示X軸的座標值
    • set key Q,W Left reverse: 將圖例與曲線標題倒過來放在圖上座標 (Q,W) 處
    • set key spacing D: 設定圖例間的寬度增加 D 倍
    • set key title "XXX": 設定圖例的名稱
    • set label "SSS" at Q,W: 設定 SSS 這三個字出現在座標(Q,W)處
    • set label "XX" textcolor lt 2: 以linetype 2 顯示 XX
    • set grid: 在各主要刻度畫出格子

標籤